Students Centric
Placements Report
Trackable results, real numbers
Reviews
Proven success, real voices
Trainers
Expert-led, Industry-Driven Training
Life at IIDE
Vibrant Spirit student life
Alumni
Successful Journeys, Inspiring Stories
Learning Centre
Webinars
Blogs
Case studies
Live, Interactive Masterclasses
Fresh Insights, quick reads
Real-life, Industry relevant
More
Hire from us
Hire Top Digital Marketing Talent
Work with us
Join Our Team, Make an Impact
Customised Training
Personalised digital marketing training for your company
Refer & earn
Simple, easy rewards
Contact us
Get the answers you need
About us
Know more about IIDE
Explore all course options
FOR FRESH GRADUATES
Post Graduation Program in Digital Marketing & Business Strategy- Ideal for Age: 20–25 Years
Can’t decide? Explore all our
Digital Marketing CoursesFOR STUDENTSOn-campus
Advanced Certification in AIFOR WORKING PROFESSIONALSOnline
Professional Certification in AI StrategyIndustry-Aligned TRACKMost Popular
UG Program in Digital Business & Entrepreneurship- Ideal for 12th Pass out / FY Degree Student
PARTNER PROGRAMS
Can’t decide? Explore all
BBA In Digital Marketing Colleges
Orginally Written by Kartik Mittal
Updated on Mar 30, 2026
Share on:
Launch It

By Shane Mielke
When graphic designer Shane Mielke published his book, “Launch It”, he also designed an amazing online data visualization. This interactive data is a spinnable world map showing live data of locations at which people could go and purchase the book.
Marvel Cinematic Universe

By Strait Times
If you are a Marvel Fan, you will know that all the characters and stories are intertwined with all the other movies.
This interactive data visualization gives you a fun way to understand connections between characters and movies inside the Marvel Cinematic Universe. Created by the data artists of the Straits Times in Singapore, this data is entertaining and easy to navigate. Marvel fans will really enjoy this one!
Although these were just some cool representations of data, many data visualizations are created to actually solve business problems. For example:
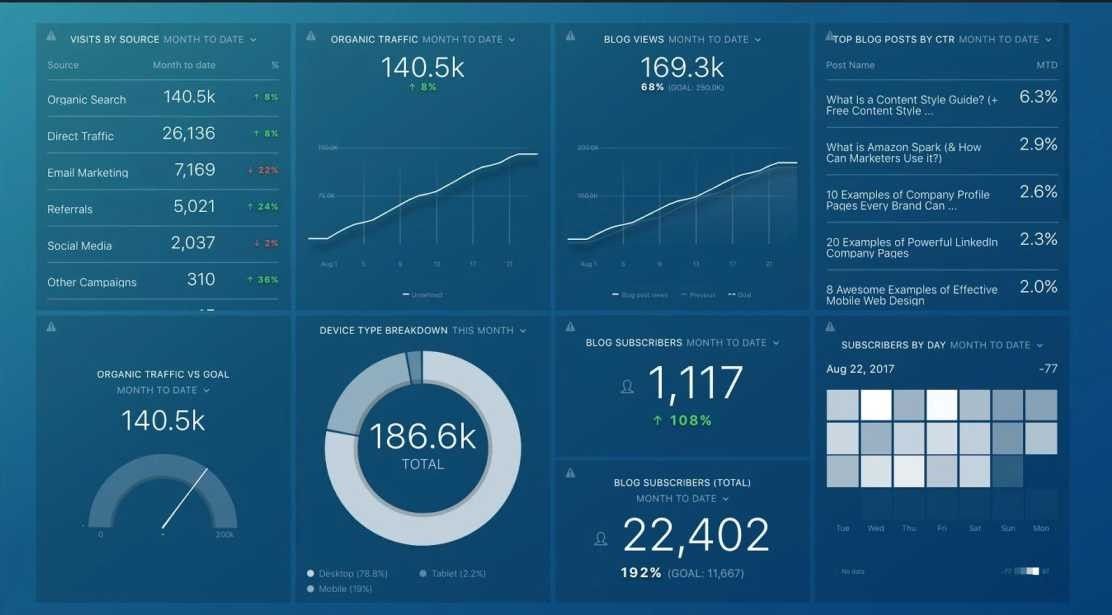
Let’s say you want to evaluate the performance of your marketing channels that include the website, Search Engine Marketing, Email Marketing, Social Media Marketing, Content Referrals and Direct Traffic.
You can enhance your skills with an online digital marketing course.
Wouldn’t it be nice if you were able to aggregate data from the different tools you use and create visual displays to compare results from the different channels over the same time period?
Data Visualizations like these can give you all this information and more:
How Data Science Compliments your Digital Design Skills
With data now being a critical source of competitive advantage, business organisations are seeking newer methods to analyze the data they have access to. Most decision-makers for businesses are now familiar with graphs, pie-charts, and other forms of visualizations that help them to make sense of sales, revenue, and other aspects of company operations.
It is commonly said that a picture is worth more than 1,000 words. It’s science. Studies have shown that 90 percent of the information that is transmitted to the brain is visual. You can use this power of the visuals to solve some other problems as well.
For example, have a look at this COVID-19 tracker. It displays the data it has aggregated from official government agencies on the virus outbreak and displays it beautifully for the people who are looking for authentic information.
Data Visualisation like this is giving rise to more dynamic content. All this content can also be used by brands to increase online engagement of users.
AI courses online provide practical knowledge of artificial intelligence.
The Netflix show “Explained” is another example of how data can be used to create content that users would look good and keeps people engaged. series that combine data with a beautiful design and presents it in such a way that everyone loves to see the inferences and insights that are gained from it.

Learn Digital Marketing for FREE

Conclusion:
A balanced approach in data visualization and analytics is thus essential in formulating an effective business strategy.
And that is where your knowledge of Digital Designing along with the knowledge of Data science will play a major role. If you are skilled in both these aspects, then every data-driven company will want to hire you.
If you want to be ready for one of the best career options of the next decade, then it is time you started learning Data Science.
Want to Know Why 2,50,000+ Students Trust Us?
Dive into the numbers that make us the #1 choice for career success


MBA - Level
Post Graduate in Digital Marketing & Business Strategy
Best For
Fresh Graduates
Mode of Learning
On Campus (Mumbai & Delhi)
Starts from
Jul 31, 2026
Duration
11 Months

Live & Online
Advanced Online Digital Marketing Course
Best For
Working Professionals
Mode of Learning
Online
Starts from
Aug 7, 2026
Duration
4-6 Months

Online
Professional Certification in AI Strategy
Best For
AI Enthusiasts
Mode of Learning
Online
Starts from
Jul 28, 2026
Duration
5 Months

On Campus
Advanced Certification in Artificial Intelligence
Best For
AI Enthusiasts
Mode of Learning
On Campus (Mumbai)
Starts from
Jul 27, 2026
Duration
3 Months

Online or Offline
Top AI Courses to Make You Future Ready!
Best For
AI Enthusiasts
Mode of Learning
2–5 Month Program
Starts from
Jul 28, 2026
Duration
Flexiable

Offline
Undergraduate Program in Digital Business & Entrepreneurship
Best For
12th Passouts
Mode of Learning
On Campus (Mumbai)
Starts from
Aug 1, 2026
Duration
3 Years
Offline
Undergraduate Program in Digital Business & Entrepreneurship
Best For
12th Passouts
Mode of Learning
On Campus (Mumbai)
Starts from
Aug 1, 2026
Duration
3 Years
Recent Post
You May Also Like
Partner & CEO at One Impact and Digital Marketing Trainer
Kartik is a certified digital marketer and an experienced marketing trainer with a strong passion for imparting knowledge in the field of digital marketing. As a marketing leader, he brings expertise in SEO (Search Engine Optimization), ASO (App Store Optimization), Website Development & much more. His curiosity and commitment to staying updated with industry trends have made him a dedicated digital marketing educator.
Kartik's dedication to teaching has led him to train over 55,000 students globally. His students range from engineers, MBA graduates, start-up entrepreneurs, marketing managers, and even those new to the world of digital marketing. His sessions have reached learners across India, Canada, Dubai, the USA, and other parts of the globe.
Kartik is committed to helping students and professionals alike understand the complexities of digital marketing, empowering them to advance their careers and businesses in this dynamic industry. His deep knowledge and practical approach have earned him a reputation as top 1% digital marketing trainer.